Version 0.2.5 released
Again, just a minor update to Urn, though with some pretty nifty features and improvements. Once again we’ve got some additional performance improvements - this shaves 0.2-0.3 seconds off the compile time of the main compiler, equating to ~7% faster.
In order to improve the efficiency of Urn, we’ve added a couple of different profiling modes to Urn. The first one monitors function calls, producing a table of how long is spent inside each function. The second profiler simply samples the call stack every 10k instructions. All call stacks are then merged together and printed to the terminal. What is especially useful is the ability to “invert” the trace, seeing what functions call a particular function instead.
There is also the ability to output text suitable for consumption with the FlameGraph tool, allowing you to generate graphics like this:
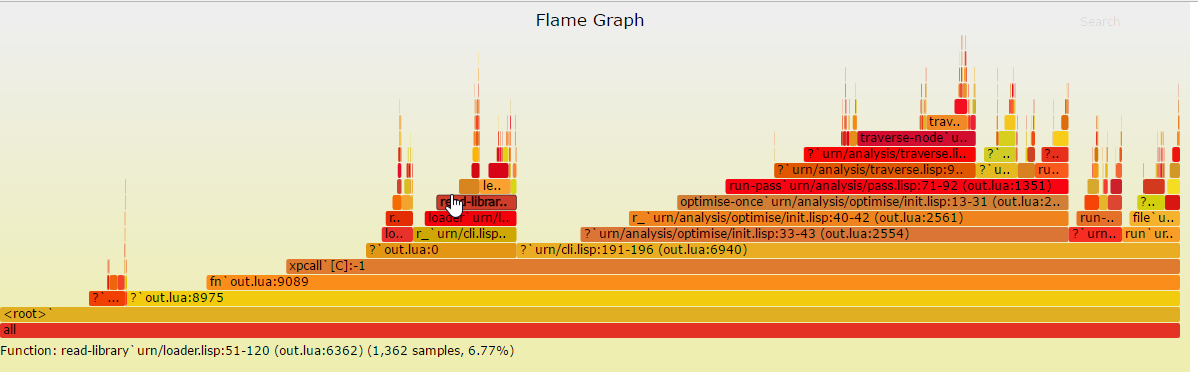
For reference, this was generated with tacky/cli.lua --profiler --stack-fold --stack-kind=flame --stack-limit=50
urn/cli -- urn/cli | perl flamegraph.pl > out.svg. This simply profiles how long the compiler takes to compile
itself. For more information about the options which can be used with the profiler, run tacky.cli --help.